Programming to Progress
Programming to Progress looked at the effects of the level of summer and afterschool programming on the the performance of Oregon public school students on standardized tests. Our data reveals that students in Oregon with access to a higher number of programs than their peers tend to perform better, after controlling for poverty. The correlation is strong for both Math and English Language Arts tests.
In our analysis:
- We looked at 993 Oregon public schools (of 1,239) because we had complete data on these schools.
- Most of the schools with complete data offer programs.
- Student performance is considered at the school level and in three areas: Math, English Language Arts, and Science.
-
Let's Get Started!
Open or Close
The vast majority of the schools in our sample (723) are elementary schools (because there are many more elementary schools in Oregon than middle or high schools). In addition, more programming is offered at the elementary school level than in middle or high school. As a result, unless otherwise specified, our analysis focuses on the performance of elementary school students. A description of our methodology and data sources is available here and includes links to the analysis itself.
Because programming typically targets low income children and includes meals, we also looked at the effect of programming on hunger — for children, families, and at the community level. We found a surprising correlation between the provision of meals as a part of afterschool programming and food security.
Programming is a complex mix of care, activities, meals, and mentoring. It is supported by a mix of different funding sources and occurs in different settings. Nuance matters in understanding programming. That’s why we developed this primer, which provides important context for the project.
Results
JUMP TO MATH RESULTS | JUMP TO READING RESULTS | JUMP TO SCIENCE RESULTS
→ A note before you read the results: We have used Free and Reduced Price Lunch eligibility as a proxy for poverty levels. In the results section, we sort schools by their rate of Free and Reduced Price Lunch eligibility. This rate is equal to the percentage of students at a school who qualify for Free and Reduced Price Lunch, based on their household income. See more about our method here
Our analysis suggests that the level of afterschool programming boosts student performance. Specifically, we found a positive correlation between the number of programs available in Oregon elementary schools and the percentage of students meeting or exceeding benchmarks (based on their standardized test scores in Math and English Language Arts).
In schools where 50% of students are eligible for free or reduced price lunch (FRLE) — the median percentage — adding a single program can increase the percentage of students achieving benchmarks in Math and English Language Arts by 1%. Although we also found correlation between the level of programming and Science scores, it was restrictively sensitive to the effects of poverty. New programs emphasizing science, technology, engineering, and math (STEM) have emerged in recent years and STEM activities have become a more prominent area of focus for traditional ones. Future analysis or student-point data may reveal more over time.
-
Effects on Math Performance
Open or Close
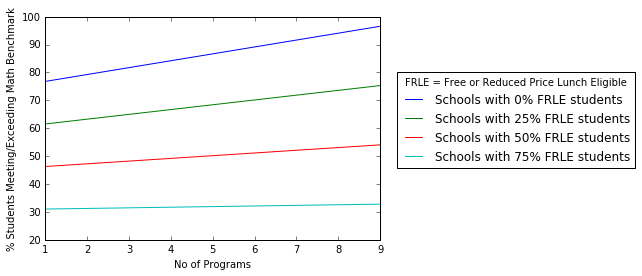
When an afterschool program is introduced to an elementary school, it tends to boost performance on standardized Math tests. How big that boost is depends on the school’s poverty level. At the median level of Free and Reduced Lunch Price Eligibility — about 50% in Oregon — adding one afterschool program tends to increase the number of students passing the math test by 1%. One percent may not sound like a lot, but the impact across Oregon can be huge: that 1% represents up to 2,467 children.
As rates of Free and Reduced Lunch Price Eligibility change, so does the size of the performance boost: as rates go down the boost increases, but when rates go up the effect decreases. That is, the performance boost is less robust in schools with higher levels of low-income students. In other words, higher levels of programming appear to boost student performance, even if not as much as poverty impedes it (See here to explore how poverty negatively affects test scores).
The graph below shows how the boost from adding an afterschool program decreases (flattens out) as the level of poverty at a school increases.
-
Effects on English Performance
Open or Close
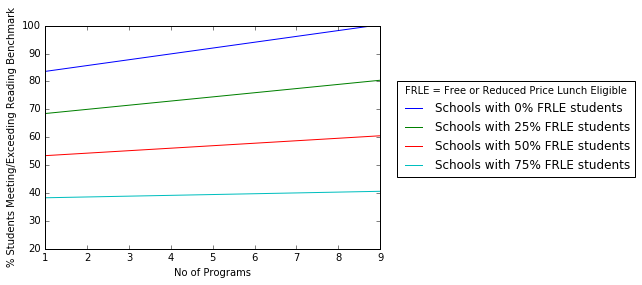
Adding an afterschool program also tends to boost performance on standardized English Language Arts tests. How big that boost is, again, depends on the school’s poverty level. At the median level of Free and Reduced Lunch Price Eligibility — about 50% in Oregon — adding one afterschool program tends to increase the number of students passing the English Language Arts test by 1%. One percent may not sound like a lot, but the impact across Oregon can be huge: that 1% represents up to 2,467 children.
As rates of Free and Reduced Lunch Price Eligibility change, so does the size of the performance boost: as rates go down the boost increases, but when rates go up the effect decreases. That is, the performance boost is less robust in schools with higher levels of low-income students. In other words, higher levels of programming appear to boost student performance, even if not as much as poverty impedes it (See here to explore how poverty negatively affects test scores).
The graph below shows how the boost from adding an afterschool program decreases (flattens out) as the level of poverty at a school increases.
-
Effects on Science Performance
Open or Close
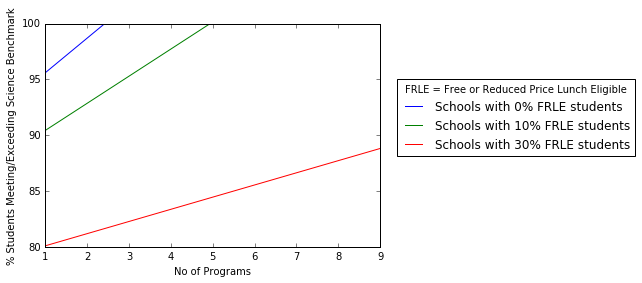
Unlike the Math and English Language Arts tests, adding an afterschool program does not appear to boost performance on standardized Science tests — at least not at the median Free and Reduced Lunch Price Eligibility rate of 50%. When you drop that Free and Reduced Lunch Price Eligibility rate to 30% (that is, decrease the number of low-income students in a school) adding one afterschool program does boost Science scores, by about 1%. One percent may not sound like a lot, but the impact across Oregon can be huge: that 1% represents up to 2,467 children.
As you continue to drop the Free and Reduced Lunch Price Eligibility rates, the boost continues to grow. Just like with the Math and English Language Arts tests, the performance boost is less robust in schools with higher levels of low-income students. In other words, higher levels of programming appear to boost student performance, even if not as much as poverty impedes it (See here to explore how poverty negatively affects test scores).
The graph below shows how the boost from adding an afterschool program decreases (flattens out) as the level of poverty at a school increases.
-
Afterschool’s Surprising Effect on Hunger
Open or Close
By the time students arrive at an afterschool program, it’s been hours since they ate lunch. That’s why most afterschool programs, particularly those serving low-income students, provide snacks. Many even provide a full meal. This extra meal can be an essential nutritional boost for students: decades of research have shown the physical, emotional, and academic advantages that come from healthy childhood nutrition.
When they attend afterschool programs regularly, children can receive up to five extra meals per week. Five meals may not sounds like a lot, but it goes a long way. In Oregon alone, afterschool programs are serving 1,613 meals every single week. That is 1,613 meal services per week, not single meals; up to hundreds of students can be served at a single meal service. To serve these meals, afterschool programs can make use of government programs such The Child and Adult Care Food Program (CACFP) during the school year, and the Summer Food Service Program (SFSP) during the summer months. The At-Risk Afterschool Meals Program, in particular, can provide a program with provide thousands of dollars per year, dedicated solely to serving food.
But even with CACFP and SFSP services, Oregon has a frustratingly persistent hunger problem. Hunger — or food insecurity — remains a problem in every single Oregon county, and Oregon hunger rates rank near the top in the country. Food insecurity is particularly prevalent in children: 1 in 4 Oregon children are food insecure. To combat our hunger problem, Oregon offers services like the Supplemental Nutrition Assistance Program (SNAP) to low-income individuals and families. Although SNAP certainly helps, it also contributes to a food security “cliff,” where families make too much money to qualify for full benefits, but don’t make enough money to actually feed themselves.
The cliff is evident in the graph below, where monthly income is plotted (by county) against the average number of meals missed. For nearly every county, the number of missed meals start to rise once families make about $200 a month — meaning they no longer qualify for full SNAP benefits, but also can’t afford three meals a day. Missed meals continue to rise until families make between $750-$1000 a month. The number of missed meals only begins to decline between 75 and 100 — that’s 75-100 missed meals per family, per month.
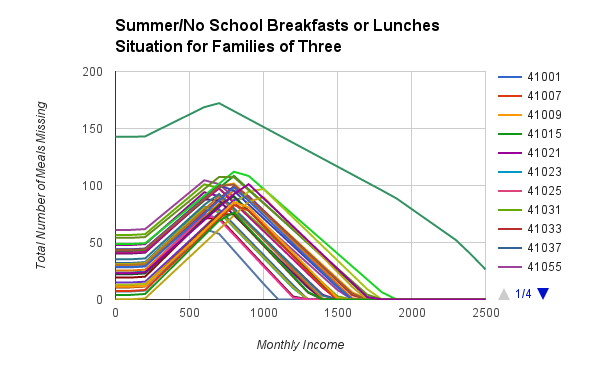
Each colored line represents a different county in Oregon. The green line at the top is an outlier, and doesn’t follow the general pattern represented on the graph. For more information on this graph and food insecurity in Oregon, check out Hack Oregon’s The Hunger Equation.
When we take into account the breakfasts and lunches served by schools, the cliff shifts, and shown on the next graph below. It become shorter and narrower, meaning that families are missing fewer meals. Indeed, the cliff itself — the income range where families don’t qualify for full SNAP benefits, but still can’t afford 3 meals a day - shrinks by several hundred dollars. For some counties, the cliff ceases to exist altogether, as represented by a flat line on the graph.
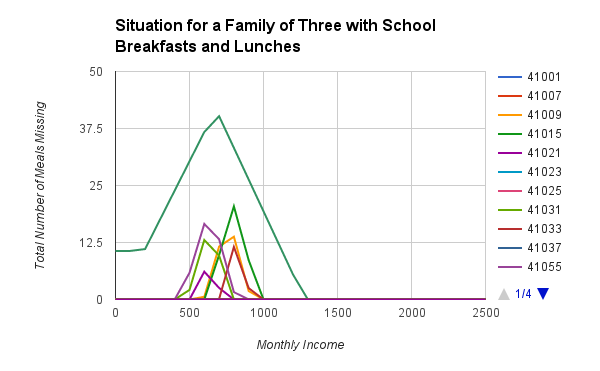
Now, imagine what the cliff would look like if we also added in the those 1,613 meals services that afterschool programs provide every week. Imagine if every food insecure child in Oregon had access to five extra meals a week, every week.
-
Graduation Rates
Open or Close
The sections above outline the link between afterschool programs and improved academic performance. In fact, we know that if there were an additional one afterschool program at every elementary school in the state, we could expect to see 2,467 more students passing the elementary-level Math and English Language Arts standardized tests.
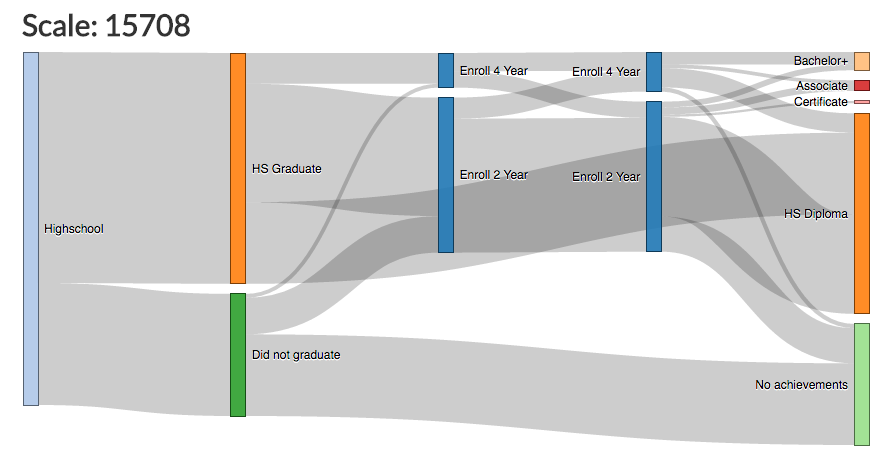
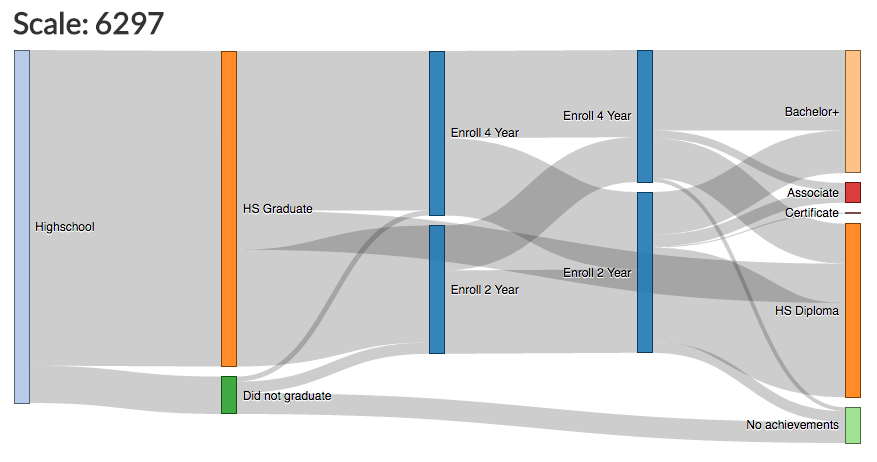
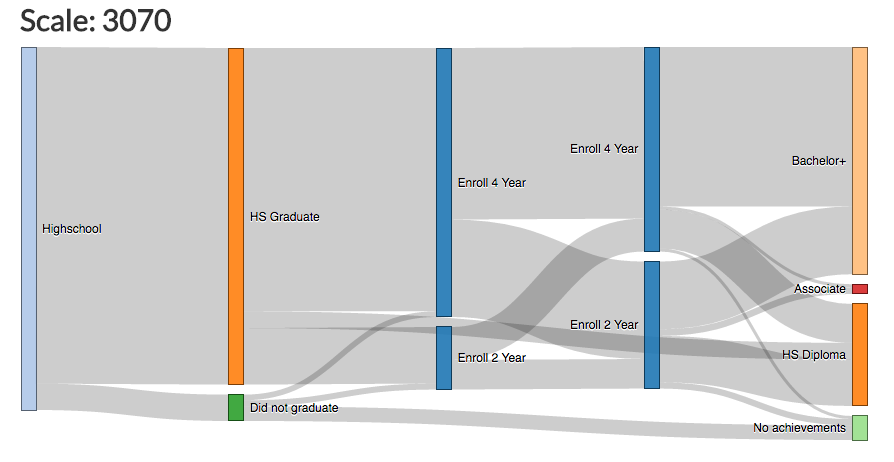
Students who pass standardized tests in elementary school are more likely to pass them in middle and high school too. Plus, in Hack Oregon’s 40-40-100 Education Pathways project, we found that students who meet or exceed benchmarks in high school have a higher chance of graduating from college with a bachelor’s degree Of high school students who do not meet benchmarks, just 5% continue on to earn a bachelor’s degree. If they meet the benchmarks, their chances of earning a bachelor’s degree go up to 35%, and if they exceed benchmarks their chances rise to 65%. Together, this makes students who participate in afterschool programs in elementary school and meet early benchmarks up to ten times more likely to graduate college with a bachelor’s degree.
On the charts below, you can see the pathway to achieving a bachelor's degree on the right-hand side. As more students meet benchmarks, the pathway grows-- meaning that more students are receiving bachelor’s degrees. Click on a chart to see it bigger.
Although student performance across these projects is not directly comparable — the 40-40-100 student cohort tested a decade ago using different instruments — the data does allow us to conclude that higher levels of afterschool programming boost student test scores, and benchmarks-level scores increase the likelihood of students both attending and graduating from college.
-
What's at Stake
Open or Close
Test scores, of course, are not the only indicator of graduation and future success. A whole host of other factors — including social, economic, and behavioral, among others — can can contribute to a student’s success. Programming can help with these factors too, but it’s still important to remember that programming matters, even if it’s not everything.
Real gaps in student performance remain — between children in poor families and their wealthier peers, between children of different races and ethnic backgrounds, and between children in rural and urban communities. And Oregon has struggled with low high school graduation rates, especially for poor children and children of color. The reasons for this are complex but a good part of the explanation has to do with money
Programing will not fix this. But it does make a difference.
Going forward
Today, 14% percent of Oregon students are enrolled in afterschool programs in their schools.If this level of programming were reduced, our model predicts that fewer students would achieve early academic benchmarks. In fact, for every program that is removed, we would expect 2,467 students to fall short of these academic benchmarks, putting them at higher risk of not achieving subsequent benchmarks — including high school graduation.
On the flip side, not all children who are eligible have access to after school programming. An Afterschool Alliance Survey of parents indicates a demand three times greater than the current supply. If programming were available to the children of the 46% of parents who want it, and children were enrolled, we might see significant aggregates gains in students performance. Specifically, 8,106 more students achieving benchmarks and increasing their likelihood of graduation from college by 35% (for students meeting benchmarks) to 65% (for students exceeding benchmarks).
-
A Programming Primer
Open or Close
What is “Programming?”
When and Where Do Kids Participate in Programming?
Programming ≠ School
- 21st Century Community Learning Centers (CCLC). A US Department of Education (Office of Academic Instruction) grant program providing afterschool enrichment opportunities for children attending high-poverty and low-performing schools, and other educational opportunities for parents and families. In Oregon, for the 2015-16 school year, there were 22 grantees serving 89 sites. CCLC is structured so that funding declines during the five-year life of the grant, with the expectation that local programs find alternative ways to sustain themselves over time.
- Child Care and Development Fund. A program of US Department of Health Human Services, Office of the Administration for Children and Families designed to assist low-income families in accessing child care so they can work or attend training/education. The program also aims to improve the quality of child care and promotes coordination among early childhood development and afterschool programs. In keeping with legislative intent of the Child Care and Development Block Grant of 2014, Oregon’s 2016-18 State Plan reflects the intent to support systems development and improve program quality.
- Child and Adult Care Food Program. A program of the US Department of Agriculture, Food and Nutrition Service that aims to provide nutritious food to young children, older adults, and people with disabilities in care settings. Oregon’s Afterschool At-Risk Meals Program is a core provider of meals and snacks in Oregon afterschool programs.
- Supplemental Education Services were authorized under the 2001 No Child Left Behind Act (NCLB) and will be replaced under its successor law, Every Student Succeeds Act (ESSA) by two categories of service: 1) Comprehensive support and improvement; and 2) Targeted Support and Improvement. The Oregon Department of Education provides information about the transition on its website.
Chances are you have a “third space.” Not home, not work, but somewhere in-between. A place you spend quality time doing something that matters to you with people you care about. Your third place might be a coffee shop where you work with neighbors on community-based projects. Or a barber shop where you exchange community news. Or a church, a neighbor’s house on bookclub night, or local yarn shop that hosts knitting circles. All of these are “third-spaces.”
Programming provides “third spaces” for young people. Not home. Not school, but places young people spend time with each other engaged in wide range of activities that help them develop. A program may be designed around a single activity — chess for example — or provide students with experiences across a range of activities. Art, music, language, entrepreneurship, leadership, environmental stewardship, games and hobbies, even academic enrichment rooted in science, technology, engineering, and math (STEM) are all common areas of focus for afterschool programs.
Nationally, in 2014, 10.2 million children participated in afterschool programming — about 18% and an increase of 10% from a decade before. If programming were available, the number of children participating could nearly double — to over 19 million.
That same year in Oregon, 91,595 children participated in afterschool programming (16%), but the need was much greater — 44% of parents indicated a demand for it. That’s 222,708 children.
For every one Oregon child participating in programming, two more are likely waiting to get in. Middle school students are especially in need of programming at their schools.
Programming is often referred to as “afterschool” or “out of school time” (OST) because it typically occurs between the hours of 3:00 and 6:00 p.m. But it also includes enrichment and learning activities that occur during holiday and summer breaks. Summer programs play a critical role for low-income children by helping them maintain learning gains from the previous academic year and through the provision of meals and social activities.
Programming can happen anywhere — in the local YMCA, a Boy & Girls Club, a church, mosque, or synagogue, a library — but most programming is offered in school, parks, and libraries, especially those supported with public dollars.
In 2014, 64% of Oregon afterschool programs were located in a public school building, and the top three providers of programming were Boys & Girls Clubs and public and private schools.
Design
Programs are structured: they offer activities during specific times, adult supervision and support, and meals or snacks. But programming is not school. It is designed around the broad goals of engaging young people in recreation and learning, providing safe care, and supporting positive youth development. Increasingly, programming offers learning enhancement opportunities rooted in STEM.
In elementary school, afterschool programs offer a mix of academic and recreational activities, and provide kids with choices about where to spend their time and how to structure it. In middle school, the model shifts to a “club” format. High school programs maintain the club format but there are fewer of them because young people no longer need child care and because more activities and family responsibilities compete for students’ time.
Programming offers young people the opportunity to engage in activities more creatively and with more freedom than school typically allows. Because there are no tests or performance assessments, and because much activity is group-based, young people can try things they’ve not done before with the support of peers and without fear of negative academic consequences.
Most programs operate on a ten-week cycle, four times per year, four or five days per week, with breaks during the holidays.
Staffing
Programs are staffed in a variety of ways, employing paid professionals, volunteers, and older students to provide care, instruction and academic, social, and nutritional support. There are efforts underway nationally to professionalize the OST workforce through training, licensure, and by establishing quality benchmarks for programs. However, with licensure comes professional development requirements, adult/student ratios, and potential pay increases, so programs often face a trade-off between improving quality and increasing enrollment. Because programs employ people and resources supported by many agencies and organizations, funding — not just the dollars themselves but the restrictions tied to them — remains a formidable challenge for program leaders seeking to meet particular needs in their schools and communities.
About the OST Workforce: Unify a Fragmented Profession, in Youth Today
School-Age Care and OST, in Youth TodayFunding
The steady increase in demand for and participation in afterschool programming over the past decade has resulted in increased investment in afterschool programming by all levels of government. Although the system is still described as a “hodgepodge,” the efforts of federal agencies, states, and municipalities have increased programming availability, and some have taken on the issue of afterschool as public policy priority. Philanthropy has played a major role in supporting these efforts. Increasingly, the business community is engaged, too. Sustaining successful approaches, however, remains a formidable challenge — especially for rural areas lacking scale (and public transportation) and low-income communities lacking resources.
The base funding most often supporting afterschool programs today comes from the following programs:
Even these brief descriptions above reveal the challenge of sustaining high quality afterschool programming: the four primary funding sources live in three federal agencies, each with different performance measures and reporting systems (at state and federal levels); two of them will transition as a result of changes to federal law; and one was created as a result of legislative changes less than two years ago.
Trends in Afterschool Programming
Based on our review of key sources and interviews with Oregon afterschool expert and OregonASK Executive Director Beth Unverzagt and Data and Grants Coordinator Katie Lakey, we identified four key trends in afterschool programming that provide context for the Programming to Progress project.
- Demand for afterschool programming continues to rise. In 2004, 30% of parents wanted access to programming; in 2009, 38%; and in 2014, 41%. Much of this demand (in Oregon and nationally) remains unmet. There are at least two children who would be enrolled in programming if it were available to them for every one Oregon child already participating.
- Equity and access remain challenges. On the one hand, afterschool programs target low-income students and families and the schools they attend. On the other hand, these programs often require “matched” funding (community support) so they can be sustained after the initial grant period ends. Most programs simply cannot generate such support, placing pressure on providers to offer “pay-to-play” models, even though affordability is already a challenge for families — especially those in rural areas. Rural communities face logistical challenges, such as where to offer programs so that the maximum number of students can participate or where busing is available. They also struggle to staff the full range of activities they would like to offer because there are typically fewer specialist instructors and support staff (visual arts, sports, STEM, etc.) than in more urban communities. Addressing these challenges raises the cost of afterschool programming in rural areas where there is less philanthropic support available.
- More afterschool programs are integrating STEM. Policy choices at state, federal, and local levels, together with the 21st Century Community Learning Center program have placed more emphasis on science, technology, and engineering and math (STEM) in afterschool programming. A consequence of linking afterschool activities to students achievement and skills, the shift does challenge programs to remain rooted in afterschool enrichment rather than becoming an extension of the school day. It also poses challenges for arts-based programs and other activities not so directly linked to the demand for skills in school or work.
- More funders are demanding measurable results. Part of a more generic shift toward evidence based policy on the part of government, business, and philanthropy, afterschool program funders and leaders are increasingly pressured to measure the impact of their investments more effectively, and find ways to generate more for less. This is challenging in the afterschool programming space because the learning outcomes are easier to measure than outcomes associated with the other goals of programming — safe care, recreation, and positive youth development — and could create incentives to design programs that are simply extensions of school.
As a key report put it, afterschool programming is “growing up” and its context is changing, making now an excellent time to take stock of what we know about programming in our state.
Key Sources
Afterschool Alliance
Charles Stewart Mott Foundation/Afterschool
The Forum For Youth Investment
Grantmakers for Education/Out of School Time Funders Network
OregonASK
Youth Today